 Geo Spaial Data Visualization
Introduction
Open data published by various organizations is intended to make the data available to the public. All over the world, numerous organizations maintain a considerable number of open databases containing a lot of facts and numbers. However, most of them do not offer a concise and insightful data interpretation or visualization tool, which can help users to process all of the information in a consistently comparable way. Canadian Federal and Provincial Elections is an example of these databases. This information exists in numerous websites, as separate tables so that the user needs to traverse through a tree structure of scattered information on the site, and the user is left with the comparison, without providing proper tools, datainterpretation or visualizations.
In this paper, we provide technical details of addressing this problem, by using the Canadian Elections data (since 1867) as a specific case study as it has numerous technical challenges. We hope that the methodology used here can help in developing similar tools to achieve some of the goals of publicly available datasets. The developed tool contains data visualization, trend analysis, and prediction components. The visualization enables the users to interact with the data through various techniques, including Geospatial visualization. To reproduce the results, we have open-sourced the tool.
Scraper
For this case study, we required to extract validated dataset of Canadian elections from different resources. The database developed by Dr. Anthony Sayers at the Department of Political Science at the University of Calgary is one of the most reliable, consistent, and accessible databases for Canadian elections. This is a web embedded database and can be accessed at: canadianelectionsdatabase.ca/ This database contains information on Canadian federal, provincial, and territorial elections since 1867 and is arranged by-election, party, candidate, and district.
For our data extraction task, we separate the Canadian Election Database webpages into two categories. Static pages and Dynamic pages. The federal election part of the website loads static pages upon clicking on any of the link to a federal election. The loaded static page includes all the necessary information about the associated federal election.
The Provincial election part of the website does not load static pages upon clicking on any of the link to a provincial election. Instead, browser send an AJAX request to the server and dynamically update the webpage with the information received from the server in the form of AJAX response.
A challenge of working with this data is the lack of having a download option to retrieve and use this information (e.g., import to analysis tools). Therefore, we developed a scraper to scrape, extract necessary data, and store them in an appropriate format, to reduce further data cleaning and polishing effort. The extracted data is intended to be fed to the other two components of the tool. We have used 2 different scraper Python function to accommodate the extraction of election data by thoroughly crawling both static and dynamic pages.
-
For the first phase of the data extraction, we store all the election data into different csv file in our server. We have used Beautiful Soup to extract information from the static pages and store them.
-
In the second phase of data extraction, we retrieve the information from the dynamically loaded webpages for provincial elections. Our second scraper function sends an AJAX request with appropriate parameters to the websites’ server on behalf of the browser. Upon receiving the AJAX request, the server sends all the associated response in a JSON file format to our function. The scraper function unpacks the JSON file to retrieve and store all the information in our local-server like the right-hand image.
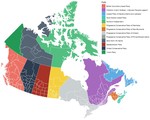
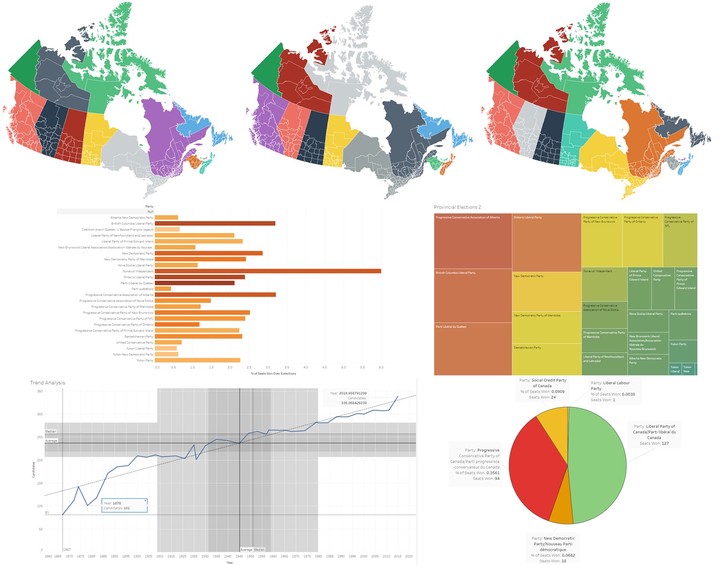
Geo-Spatial Data Visualization
In the second component of the tool, we have generated Geo-spatial map using R script. We needed get the actual map data with longitude and latitude information. In the case of Canada, central statistics agency provided map shape files that we could use. The Shape File format (.shp) is the most widely-used standard for maps. We grabbed the files to convert them to a format the tidyverse library can use.
Conclusion
Open data is meant to be used by the public and provide data-driven decisions. However, visualization tools are required to make the data interpretable. One of the other challenges to provide the analysis and visualization tools for open data is the different formats of the data that are published by various parties in separate databases. In this paper, we provided architecture and the technical details of an open-source tool that we developed for collecting data, and visualizing and analyzing information. Although the tool is developed explicitly for Canadian Election data, the technical details and the approach can be used by researchers from various fields and developers to address the issue of open data, such as having separate databases with no interpretation tool
Publications
Geo-Spatial Data Visualization and Critical Metrics Predictions for Canadian Elections