 Review-Viz
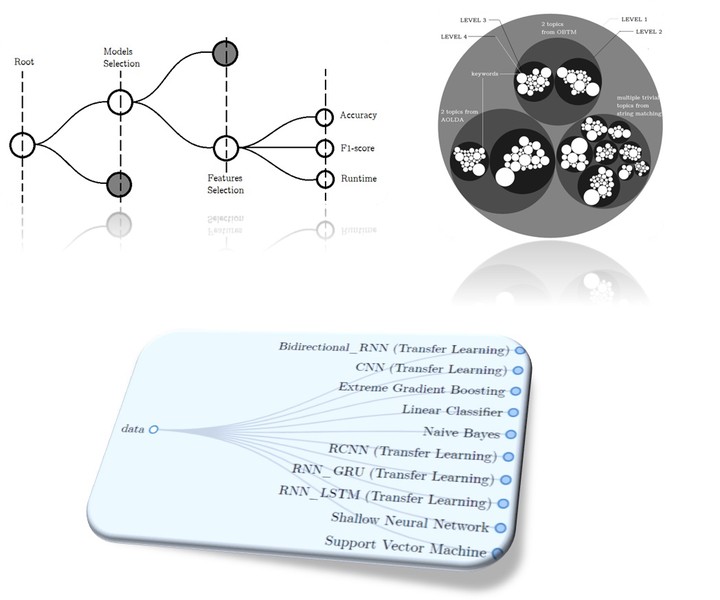
In our recent work, we have developed a replication package for the mobile application developers to help them isolate/classify energyrelated feedbacks from app-reviews and further investigate these reviews for potential issues crucial to the energy efficiency of the application. This package lets the developer decide which model to use and which features to choose based on their convenience at any given time. Additionally, the package helps the developer to deploy topic modeling algorithms to identify new issues/causes related to energy efficiency. Using this package, we have performed an empirical study with the participation of 4 developers. They have exhaustively performed all the models, feature combinations, and different topic modeling algorithms and carefully examined the generated result set manually.
Contribution
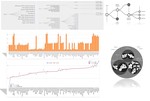
The resultant computational analysis (much like the output of our replication package) can be effectively combined with human reasoning with the help of powerful visualization that could lead to increased efficiency and more valuable results. So, we developed an interactive visualization tool to help the developers assimilate the result of the discussed empirical study of over 90 models, features combinations. Additionally, The tool also helps to visualize the output of the topic modeling algorithms to identify recent potential issues most likely to cause energy inefficiency in the app. For flexibility, it gives the developers options to choose the representation of a certain outcome.
Tool Architecture
The architecture of the tool contains two main components. The components were structured based on two essential purposes: (a) Present the extensive outcome of classification techniques of the energy-related reviews and (b) Demonstrate the outcome of topic modeling approaches to automatically discover underlying issues causing energy inefficiency. Each component is necessary to accomplish insightful data interpretation for helping developers to process all the information in a consistently comparable way.
Result
We have provided our visualization tool to four developers who participated in our study. The developers had the independence of not choosing the visualization tool for careful inspection of the resultant dataset, but all of them found the visualization tool to be highly conducive for the exploration of the result set. We have also invited 4 of the undergrad students (who had the basic knowledge of machine learning and were paid for the tool-evaluation) to find out the perspective of fresh/new users. All of them reported that visualization tool to be robust and engaging. One of the student participants pointed out the lack of options presented in the topic modeling part, which we found to be true. Nevertheless, at the same time, the comprehensiveness, smooth interactability, aesthetic features, and user-friendliness of the tool was also highly commended. Before implementation, we have researched different ways to find a convenient and concise way of presenting the generated data so that developers could compare and utilize the extracted information with maximum efficiency. We have successfully delivered an interactive visualization tool that would be constructive and supportive for the developers who frequently analyze and inspect user feedbacks to identify energy efficiency issues.
Publications
ReviewViz - Assisting Developers Perform Empirical Study on Energy Consumption Related Reviews for Mobile Applications